The most important KPIs in E-Commerce
Key performance indicators (KPI) help to manage e-commerce and online shops by quantifying strategic and operational target values. This article presents the most important e-commerce KPIs and explains how e-commerce is managed using KPIs.
Do you need support with the creation or further development of a key figure model for your online shop? Then use the short line to Prof. Richard Geibel: Tel. 0221 973 199 722, Mail: info@ecommerceinstitut.de. The video below gives you a first impression of the e-commerce KPIs:
Contents:
- Explanation of the most important KPIs
- The e-commerce code as a key figure model
- Key figures for more innovations
- Key figures for economies of scale
- Customer loyalty metrics
- Financial metrics to measure success
Every corporate management in e-commerce, therefore, requires an assignment of suitable KPIs for e-commerce after the objectives have been determined. Due to a large number of indicators and metrics available, many companies find it difficult to select the best KPIs for e-commerce from the abundance of indicators. Often, KPIs are placed side by side in a catalogue rather than being placed in a context. Therefore, when selecting the e-commerce KPI, this context must first be established by defining goals and the objects of the controls. So two questions are answered:
- Where is controlled?
- What is being controlled?
E-Commerce KPIs – the most important indicators in the sales funnel
The most frequently used e-commerce KPIs represent online sales funnel. In this process
- a user visits an online shop,
- selects products there,
- puts them in the shopping cart,
- goes through the checkout process and
- eventually completes the purchase.
This process can best be mapped using the following e-commerce KPIs:
Visits or Unique Visitors
Visits are a classic analytics KPI that is often viewed as a performance parameter for online marketing. Depending on the question, individual visits or the number of visitors or users are used. Since a user can visit a page multiple times, the number of visits is typically greater than the number of users or unique visitors.
Engagement KPI for e-commerce: page views, time-on-site, bounce rate
Engagement KPIs indicate the intensity with which users use the content of a page and whether the page is perceived as sufficiently attractive to select products for the shopping cart. The number of page views stands for the relevance and accessibility of individual topics, the size of time-on-site – the length of time individual pages are used – for the quality of individual pieces of information, and finally the bounce rate for irrelevance or technical problems on the page.
Add-to-cart number and quota
These indicators stand for how often a product is placed in the shopping cart and how often the shopping cart page is visited compared to other pages.
Checkout cancellations
This number indicates what percentage of the original intended purchases will not be completed.
Conversions and Conversion Rate
The number of conversions is the number of purchases actually made in the online shop. The conversion rate indicates what percentage of users actually became buyers.
Shopping cart size
The shopping cart size shows how much money was spent on average per purchase. The size of the shopping cart, together with possible income from shipping fees, gives the sales per order and thus also reflects the customers’ willingness to pay.
The size of the shopping cart is significantly influenced by the price and article structure of the online shop. A shopping cart that is too small often leads to losses, as the direct costs of the order and the order and shipping processing cannot be covered or only partially covered, let alone a proportion of the overhead costs.

Contact costs CPC and CPO
The contact costs arise in online marketing and measure the effort for a contact – that is the CPC – or for an order – that measures the CPO – to provide. The CPC is the cost-per-click parameter, which either arises specifically as a contact price for individual online advertising formats such as Google Adwords or can also be calculated as a cost-per-contact for all online contacts.
The value cost-per-order allocates all direct contact costs of the online shop to all orders and is, therefore, a measure of how much marketing effort has to be made in relation to the shopping cart in order to implement the order. A CPO that is too high due to intense competition and inadequate marketing measures is often a risk of loss for online shops.
Return rate
An e-commerce business is only successful if a customer is satisfied with the way the order was placed, the goods and the shipment so that he waives the right to cancel. A high return rate is, therefore, a risk of loss and therefore requires special attention from the management of the online shop in the context of returns management.
However, in the business models of the online fashion industry, returns are often explicitly provided for in order to solve the problem of the accuracy of fit of garments, so that a comprehensive solution to the returns problem is not currently a sight in this industry.
Direct costs for goods and delivery – purchase, fulfilment and shipping costs
In order to determine the contribution margin that results from orders in the online store, the direct costs must be deducted from the income from online orders. In addition to the direct marketing costs, these are also the direct costs for the use of goods, the costs incurred for the processing of the order, the fulfilment, and the packaging and shipping costs are deducted.
Determination of the contribution margin II from online orders
With the help of the e-commerce KPI mentioned, the total contribution margin II can now be determined using an operational e-commerce model. This is generated in the online shop as gross income to cover overhead costs:
CM II = V x [CR x (SC – DC) – DCC] with
V: Visits
CR: conversion rate
SC: shopping cart and shipping revenue
DC: direct costs for goods, fulfilment and delivery
DCC: direct contact costs per visitor
The concrete and more detailed modelling of the sales funnel depends on the design of the funnel and the conversion concept of the respective online shop. To optimize the sales funnel in the event of insufficient contribution margins and conversions, the process should be optimized from back to front in order to eliminate bottleneck factors. No matter how high a conversion rate or visitor number, it is actually ineffective as long as a high return rate destroys business success.
In order to eliminate these or other inadequacies in the business model or, even better, to develop and control an innovative and diversified business model, key figures for strategic, tactical and other operational goals in e-commerce are presented in the second part of the article.
E-commerce KPI – the E-commerce Code as a key figure model
Every company, including companies in e-commerce, pursues the strategic goal of long-term or better: to survive profitably for as long as possible. This global goal can and must be operationalized in all industries and companies by identifying the key success factors and integrating them into a target system.
In the “The E-Commerce Code” model, the essential success factors for e-commerce companies in the digital transformation are derived and put into context. After that, e-commerce companies can increase their potential for business success by placing the following factors at the centre of the company
- Customer Centricity
- Innovations
- Achieving economies of scale
- Data-Driven Marketing
The implementation of these factors in the sense of target achievement requires in the next step a determination of control levels on which measures to implement the factors are carried out. The next step is to map and structure the value chain or supply and service chain in order to implement the success factors as comprehensively as possible. The supply and service chain in e-commerce comprises the four combined functional areas
- Business model & strategy
- Product & content
- Channels – Online Marketing & Logistics
- Segments – customer care
An e-commerce scorecard can now be developed from the connection between success factors and control levels, which takes into account all essential levels and factors of e-commerce success. This is shown in the following graphic as an e-commerce code scorecard:
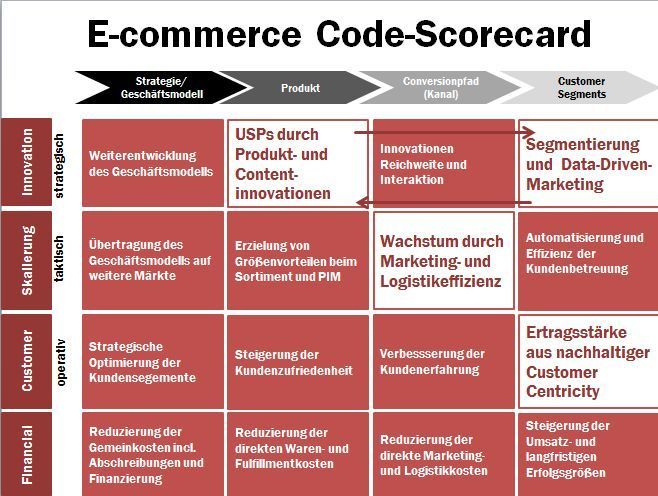
This scorecard implements the success factors of the e-commerce code in the individual control objects or areas by defining and pursuing specific goals.
Example: For the product area, the customer centricity success factor is implemented by primarily focusing and improving customer satisfaction with the company’s products. In the next step, the indicator and e-commerce KPI for customer satisfaction is the percentage of positive reviews and ratings by customers. A low return rate also shows that customers are satisfied with the products.
The E-Commerce Code – Target Level Innovations
At the target level of innovations, the company must achieve that all areas of the supply and value chain are digitalized and ideally achieve differentiation and unique positioning through innovations. In the following, measures to achieve innovations through important e-commerce KPIs are shown.
Innovation target: control parameter business model / strategy
- R&D budget: how much does a company spend compared to benchmarks?
- Number of contract types: the company is developing new contract and revenue models such as subscription or sharing models
- Number of patents & their term: could your own developments be patented and is the term of the patents long?
- Number and efficiency of suppliers & partners: is there a high-performance supplier and partner network through which innovations are made available?
- Employee turnover: do the employees see a sufficiently high development potential that the turnover is low?
Target innovation: control parameter products
An online store is primarily defined by the range of products offered and its structure. Depending on the share of consumer goods, the number or share of new products and product innovations is also decisive for long-term market success. These can be illustrated by the following key figures, among others.
- Number and proportion of new products: What is the proportion of product innovations in the range
- Number of new product categories: new topics are addressed in the range
- Proportion of the contribution margins of new products to the total contribution margins: what is the proportion of the new products in the value-added
- Scope and proportion of new and innovative content: new and innovative content is also provided for the range
- Social media and brand innovations: the brand is communicated with innovative concepts, inside and outside of social media
- Newsletter KPIs such as subscription rate, click rate and unsubscribe rate: the KPIs for the newsletter offer a good “barometer” to measure the long-term attractiveness of topics, products and communication with customers
Target innovation: control parameter channels / conversion paths
The channels and conversion paths map the contact with the customer, the path taken by the customer to purchase and the delivery of the goods to the customer. At the innovation target level, changes in media usage behaviour, in customer communication and in logistics must be mapped or anticipated for the paths and channels. Possible e-commerce KPIs are:
- Number of mobile users
- Number of mobile conversions
- Share of mobile conversions in the total contribution margin
- The Mobile GAP:
(Share of mobile conversions in DB – the share of mobile users) / Share of mobile users) - Number of logistics and shipping innovations
Target innovation: control parameter segmentation and data-driven marketing
Innovations on the control level Customer Segments arise primarily from a consistent switch to data-driven marketing and consistent segmentation of customers. Key figures that depict these measures can be:
- Number of customer segments
- Number of innovations in customer service
- Offers for customization & personalization
- Use of targeting, retargeting, cross-device tracking and other innovative marketing technologies
The E-Commerce Code – Target Level Economies of Scale
Economies of scale – i.e. improvement in output cost elasticity – are the growth engine of digitization. Consistent automation and increased efficiency when using digital technologies (hardware and software) can systematically reduce average costs. The resulting efficiency gains are needed to finance further innovations. Economies of scale can arise at all control levels. In the following, some key figures have presented that stand for the achievement of economies of scale.
Target economies of scale – control object customer segments
Economies of scale at the level of the customer segments are achieved primarily through data-supported marketing. The more consistently this is implemented, the more the company can differentiate in the segmentation of customers and serve a larger number of customer segments.
E-commerce KPIs, which depict economies of scale in the customer segments, provide information about the performance of data-driven marketing. The efficiency of customer care should also be monitored. Here, through automation, which must not be at the expense of customer perception, customer support costs can be reduced.
- Number of customer segments per channel / or per employee /…
- Number of customers per segment: the more differentiated the segmentation, the smaller the customer segment. However, the number of customers in the customer segment must be put in relation to the total number of customers.
- Number of customer care cases per employee
- Customer care costs per customer
Target economies of scale – control object: individual channels
Due to the high number and repetition of process steps, the channels of communication and distribution are particularly suitable for achieving economies of scale. Economies of scale in communication mean that more and more users can be reached with a given online marketing budget. The most important key figures for mapping online marketing efficiency are:
- ROMI: Return on Online Marketing Invest. This output-cost ratio can be determined both globally and per channel.
- Cost per click per channel: This figure shows the market price for customer contacts and thus the value of a customer contact. The Adwords CPC can be used as the market price for search engine optimization, since search engine optimization and search engine marketing are substitutes with Adwords.
- Cost per acquisition (CPA) or per order (CPO) per channel: This e-commerce KPI allocates the direct costs of online marketing to the orders actually reached. This allows the costs of online marketing to be compared with the contribution margin from the sale of goods. The CPO or CPA corresponds mathematically to the relationship between CPC and conversion rate and CPC. The higher the conversion rate, the lower the CPO:
- Cost per impression (CPI) per channel / CPM: If the aim of a tiered online marketing process is to include impressions at an early stage, the cost per impressions indicator has established itself for this sub-step. If you summarize the display in groups of 1000s, you get the well-known contact price in thousands.
- Page visitors per channel (direct, paid search, organic search, referral, email, social media, display, affiliate …): The number of visitors per channel is an important indicator for the balance of the online marketing portfolio.
- Conversions per type of sales location (shop, Amazon, eBay, affiliate, …): The number of conversions on different sales platforms reflects the suitability and degree of optimization of these platforms in relation to the company’s sales targets.
- Newsletter opening rate: is an indicator of the general attractiveness of the newsletter and the specific subject line
- Newsletter click rate: This KPI indicates how often the links used in the newsletter are clicked. It stands for the attractiveness of the content, the links and the quality of the user experience in the newsletter.
- Newsletter subscribers per visitor: the willingness of a user to subscribe to a company’s newsletter is an indicator of the satisfaction of the customer or user and the attractiveness of the brand
- Unsubscribing from the newsletter: Unsubscribing from the newsletter is a negative indicator that indicates that the newsletter is not considered attractive
Target economies of scale – control object logistics process: target values of logistics competence and efficiency
Like the marketing channels, the delivery or logistics channels also make a significant contribution to the growth and increase of equity in the e-commerce business by increasing efficiency. Important e-commerce KPIs in logistics are, therefore:
- Delivery time: the time from receipt of the order to delivery of the package to the customer
- Fulfilment time: Time from the order to the delivery of the package from the fulfilment centre to the package carrier
- Shipping costs per order/delivery: the direct costs incurred by the carrier or forwarding agent per order or delivery.
- Packaging costs per order/delivery: the direct costs of packaging
- Fulfilment/handling costs per order: the direct costs of processing the order
- Storage space and storage costs per product: Indicator for storage efficiency and the efficiency of procurement logistics
- Turnover: indicates the frequency with which an item in stock is sold.
- Purchase order quantity: an indicator of order efficiency and the turnover of goods. The Andler formula for the optimal order quantity can be used as a theoretical model
- …
Target economies of scale – control object shop, content and platforms
The online shop, individual content and the company’s platforms can also achieve economies of scale by increasing the range and effectiveness of these objects with a given effort. Indicators that measure this effectiveness are:
- Bounce rate or bounce rate
- Time-on-site or visit time per page
- Pageviews per visit or number of pages per visit
- Site Search: Frequency of use of the internal search as an expression of a positive expectation of the online shop
- Site Search with no result: Indicator of a discrepancy between the users’ expectations of the online shop and the actual offer
Target economies of scale – control object products, assortment, warehouse: target values of purchasing and assortment competence and efficiency
At the assortment and product level, economies of scale arise if a larger assortment and the associated demand can be managed with existing resources in the organization. Several indicators are conceivable for this:
- Number of keywords: The number of keywords not only represents the size of the range, but also the size and heterogeneity of the demand.
- Number of SearchVolume / Search Value: the extent of the search volume of the relevant keywords is also an important demand indicator
- Intensity of competition in search marketing: The competitive value shown by Google Adwords is a quality indicator for the market. The higher the intensity of competition, the more difficult it is to be successful online.
- DB per supplier: the contribution margins achieved per supplier are an indicator of the efficiency of purchasing. If this value is low, it indicates an inefficient supplier portfolio.
- ABC products, DB per ABC product: the classification of products in an ABC scheme helps to control the range and to focus on the most important articles. When classifying into the three categories, the contribution margin achieved should be used after goods, shipping and online marketing costs.
- Conversion rate per category & product: A conversion rate differentiated according to product categories and products indicates the efficiency of the online shop.
- Return quota per category & product: The return quota is particularly high if the customer’s expectations after visiting the online shop do not match the order delivered.
- Abandoned shopping carts are an indicator of insufficient checkout problems or other inconsistencies in the flow of behaviour in the online shop
- Shopping cart products: the more frequently products are placed in the shopping cart, the better the attractiveness of the product pages can be assessed
The E-Commerce Code – target level customer loyalty and customer satisfaction
A key success factor of the most successful e-commerce companies is customer focus. The interests and needs of the customers are consistently given priority, also in relation to the business model and product range. The central indicator of customer focus, satisfaction and loyalty is the customer lifetime value, which measures the success of the investment in a customer relationship.
Target customer loyalty – control object customer segment:
- Number and value of customer reviews:
- Customer Lifetime Value
- Customer Acquisition Cost
- Customer Care Costs
- Contribution margins per time unit per segment
- Average revenue per user
- Churn & retention rate
- Share of new & returning customers
- ABC customer analysis shares
- Frequency of visit
- Number of customers and value of customer segments
- Distribution of the devices through which customers access the pages
- Distribution of browsers through which customers access the pages
- Times of the day when customers have access
- Frequency of access to individual landing pages
- Distribution of customer locations
Target customer loyalty – control object channels:
Customer loyalty depends to a large extent on the channels through which customers are acquired. This is why e-commerce KPIs are important, which reflect the performance of the channels and conversion paths in terms of generating profit margins.
- Conversion rate
- Contribution margin per visit
- Contribution margin per visitor
- Temporal duration of the conversion path
- Distribution of the payment method
- Contribution margin per payment method
Target customer loyalty – control object products:
The range, unique selling points in the range and the demand for them are even more central for customer loyalty. These parameters can be measured with the following indicators:
- Impressions
- Number of orders
- Number of items per order
- Shopping cart value per order per customer segment
- Add-to-basket rate
- Returns/success rate
- DB per category
Target customer loyalty – control object business model/strategy
Finally, customer parameters can also be controlled at the level of the business model. Above all, the quantity and quality of the focused customer segments can be controlled:
- Number of customer segments processed
- Shopping cart height per customer segment
- Payment defaults per customer segment
- Collection costs per customer segment
Financial indicators: target values for external accounting as a measure of operational success
Finally, financial indicators complete the e-commerce code scorecard and convert the operational and strategic performance indicators into accounting parameters.
- Profit
- Sales
- Cost of sales
- Contribution margin calculation
- Gross profit
- Overhead costs, including personnel and other administrative costs, IT costs, depreciation
- Marketing Sales Quota
- Personnel turnover ratio
- Profitability
- Balance sheet ratios
- Cash indicators
Our offer – use key figures effectively
Do you need support in developing a key figure model for your e-commerce? We gladly support you. Use the short line to Prof. Dr. Richard Geibel:
- Phone: 0221 973 199 722
- Mail: info@ecommerceinstitut.de
Literature:
Peter Höschel/Thomas Jäger: Controlling für den Erfolg – Mit einfachen Werkzeugen zu mehr Gewinn im E-commerce, München o.J., verfügbar auf shopanbieter.de
Richard Geibel/Robin Kracht/Dominik Große Holtforth – Schlüsselfaktoren im E-Commerce – Innovationen, Skaleneffekte, Daten und Kundenzentrierung, zweite Auflage, Wiesbaden 2020.