Bitcoin Wealth Is Becoming More Evenly Distributed Over Time 3/4
Bitcoin Wealth Is Becoming More Evenly Distributed Over Time
Widespread Estimates Of Individual Bitcoin Ownership Concentration Are Oversimplified And Irrelevant.

This content is for informational purposes only, you should not construe any such information or other material as investment, financial, or other advice.
Before reading the second part of the article, you can find the first part of the article here.
[…]
5. How Bitcoin wealth distribution has changed over time
In chapter 2 we learned about the various number of variables to consider when attempting to estimate individual Bitcoin holders’ wealth concentration. It became clear that several of the listed variables simply cannot be decrypted in a reliable fashion – this automatically results in a (somewhat unsatisfactory) wide range of estimates with an upper and lower bound for the wealth concentration of individual Bitcoin holders. In chapter 3 we examined some of the most common narratives surrounding BTC wealth concentration and learned how to dismantle those arguments (e.g. by checking if all variables listed in Chapter 2 have been accounted for). Chapter 4 revealed Bitcoins’ early distribution history and shows that the launch was conceptualized arguably in the fairest way possible at the time.
In this chapter, we observe how Bitcoin wealth distribution has changed over the last 13 years. Is it becoming more concentrated or evenly distributed? Which econometric measures can we make use of to find out and are they reliable? Let’s dig deeper.
5.1. Gini coefficient
A common statistical construct for describing wealth inequality is the Gini coefficient. The Gini coefficient compromises the findings of a Lorenz curve into one simple number ranging from 0 to 1. Perfect equality is represented by the number 0, while 1 represents complete inequality.

The Lorenz curve graphically represents the percentage of wealth accumulated by various portions of the population ordered by the size of their wealth.106 The line of equality is at a 45° angle and represents the perfectly equal distribution of wealth (see image above). The area between the line of equality and the Lorenz curve can be used to determine the Gini coefficient: A/(A+B)
Calculating the Gini coefficient for Bitcoin is – once again – not straightforward. Some of the same challenges described in previous chapters present themselves once more: Users can have multiple addresses, custodial wallets represent multiple users, etc. As discussed in chapter 2.3. in regards to peeling chains and dust wallets – hundreds of millions of wallet addresses must be excluded to reliably interpret the blockchain data for these purposes (if not, the Gini coefficient is miscalculated and turns out to be 0.99+). In a recent research article (Dec. 2021) titled “Characterizing Wealth Inequality in Cryptocurrencies,” the researchers start calculating the Gini coefficient of Bitcoin by introducing a requirement of a minimum balance:
For instance, introducing a requirement of a minimum balance of USD 100 for inclusion in Gini calculation can significantly improve accuracy by eliminating several addresses with very low or zero balances.107
To further calculate the Gini coefficient for Bitcoin, they utilized Bitcoins UTXO model of transactions:
To accurately understand the wealth distribution over time […] we need to process all the successful transactions and construct a timeline of balances for all known addresses. The obtained dataset exhibits three characteristics of Big Data: volume, velocity, and variety.
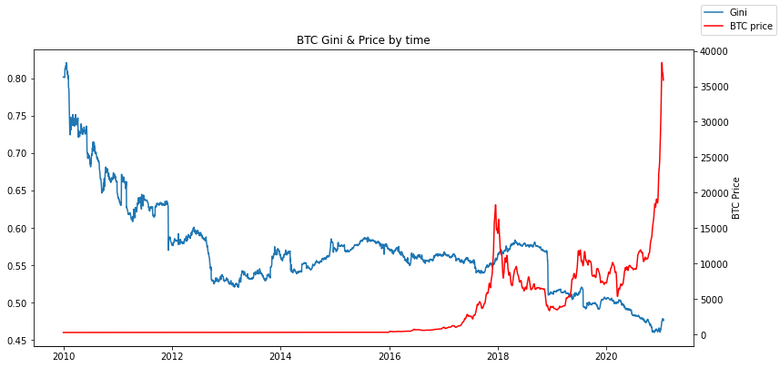
The data is then extracted and analyzed (more info in the paper itself from 3.2. onwards).108 The results for the Bitcoin Gini coefficient over time looks like this:
Since Bitcoin went live on the 3rd of January 2009, the Gini coefficient has been almost steadily declining. The wealth distribution of Bitcoin, according to these recent analyses, is in line with real-world economies. The calculated Gini value for Bitcoin is around 0.65, but according to the graph above (and below), it is around 0.48. When adjusting the wallet clustering method, the Gini coefficient increases up to 0,73.109 Another source from 2019 calculates a Bitcoin Gini of 0.672 (although it only takes the top 10,000 addresses into account).110 Again, it becomes clear that results vary wildly depending on the methodology – but the Gini coefficient of BTC is declining, no matter which recent research one looks into. For comparison:
The average Gini value for the world’s wealth distribution is 0.8; however, it is worth noting that the results vary considerably by country, with a median value of 0.73.111
Cylynx, a company offering blockchain forensics services, came to a very similar result when processing and visualizing their on-chain data of the BTC Gini coefficient:112
The flattening out of the curve is a good sign of general retail interest and holding power of BTC.113
Debunking a widespread Bitcoin Gini falsehood
Similar to the wealth concentration for the top Bitcoin holders, the Gini coefficient of Bitcoin is oftentimes calculated in an oversimplified manner which leads to some bizarre articles. David Rosenthal debunks the widespread myth that the Gini coefficient of “Bitcoin is worse than North Korea” in his blog post from 2018.114 It astonishes me that such easy to debunk misinformation spreads so far and wide in the first place – I quote Mr. Rosenthals blog post:
In his testimony to the US Senate Committee on Banking, Housing and Community Affairs’ hearing on “Exploring the Cryptocurrency and Blockchain Ecosystem” entitled Crypto is the Mother of All Scams and (Now Busted) Bubbles While Blockchain Is The Most Over-Hyped Technology Ever, No Better than a Spreadsheet/Database, […] wrote:
wealth in crypto-land is more concentrated than in North Korea where the inequality Gini coefficient is 0.86 (it is 0.41 in the quite unequal US): the Gini coefficient for Bitcoin is an astonishing 0.88.
The link is to Joe Weisenthal’s How Bitcoin Is Like North Korea from nearly five years ago, which was based upon a Stack Exchange post, which in turn was based upon a post by the owner of the Bitcoinica exchange from 2011. Which didn’t look at all holdings of Bitcoin, let alone the whole of crypto-land, but only at Bitcoinica’s customers.115
The Bitcoin Gini of 0.88 is still commonly referred to when debating Bitcoin wealth distribution. I just had someone recently comment using that exact number on my last LinkedIn post. It amazes me that this specific number, which is based on a simple forum post from over a decade ago, still circulates today.116
Caveats of the Gini coefficient
It is important to note that the usefulness of the Gini coefficient in regards to measuring wealth distribution in cryptocurrencies is controversial – opinions differ. For example, Vitalik Buterin, founder of Ethereum, describes the caveats of the Gini coefficient in his article “Against overuse of the Gini coefficient:”117
The Gini coefficient combines together into a single inequality index two problems that actually look quite different: suffering due to lack of resources and concentration of power.118
Acknowledging the weaknesses of the Gini coefficient, especially in regards to non-geographic communities (e.g. internet and crypto), it cannot serve us as the only metric to rely on and conclude that Bitcoin is becoming more evenly distributed. Therefore, we will look into more data to see if it also indicates a better distribution over time.
5.2. Nakamoto index
Another method of measuring wealth inequality is the Nakamoto index. While the Gini looks at the spread of wealth distribution over the whole population of participants, the Nakamoto index is restricted to only the minimum number of participants that control 51% of the wealth in the ecosystem.
Due to this difference, it is possible though unlikely to get a small Gini value (high wealth distribution) with a small Nakamoto index (a small number have 51% control). A small Gini value signifies a fairer wealth distribution among all the participants. A small Nakamoto index represents wealth concentration for only 51% of the wealth distribution in the ecosystem. This result indicates that only a small proportion […] controls 51% of the wealth in the ecosystem; however, over the whole population of all participants, the wealth distribution may be more even. Similarly, it is also possible to get a big Gini value with a big Nakamoto index inferring an uneven wealth distribution over the whole participant population but a more fair distribution in the participants who control 51% of the wealth.119
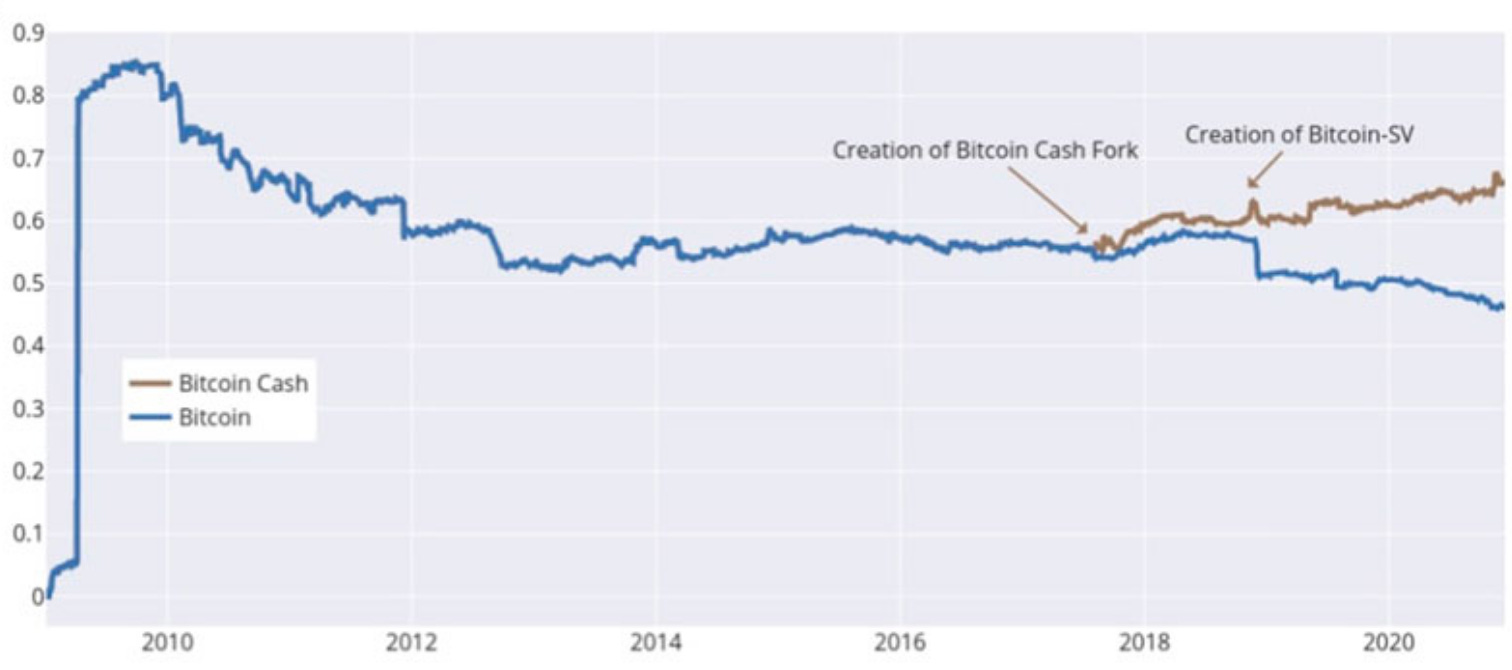
The Nakamoto index is far more susceptible to rapid changes – it can be readily skewed by a few large transactions from large wallet addresses. The Gini index is substantially more stable and takes into account much more information from numerous addresses. This is how the Nakamoto index for Bitcoin changed over the years:
Bitcoin Nakamoto index stayed low in the early years, with only 1,840 accounts controlling over 51% of all the Bitcoins in the ecosystem until 2012. This value has since increased to 4,652 in 2020, demonstrating a high wealth concentration. However, the trend towards a more even distribution of wealth observed over time in the Gini value can also be seen through the steady increase in the Nakamoto Index’s value for Bitcoin […].120
As learned in chapter 2, these “accounts” include exchange wallets and other variables. Although both metrics have their weaknesses, together they provide us with more expressiveness:
- Bitcoin Gini coefficient has declined significantly
- Bitcoin Nakamoto index has increased significantly
Both metrics demonstrate that Bitcoin is becoming more evenly distributed over time. The Gini index is better for comparisons and long-term patterns, whereas the Nakamoto index is probably better for capturing events and instantaneous dynamics.121 Next, we take the current global Bitcoin adoption stage into account and take a closer look at how market dynamics (e.g. Bitcoin bubbles) influenced the distribution.
5.3. Early adopters phase and market dynamics
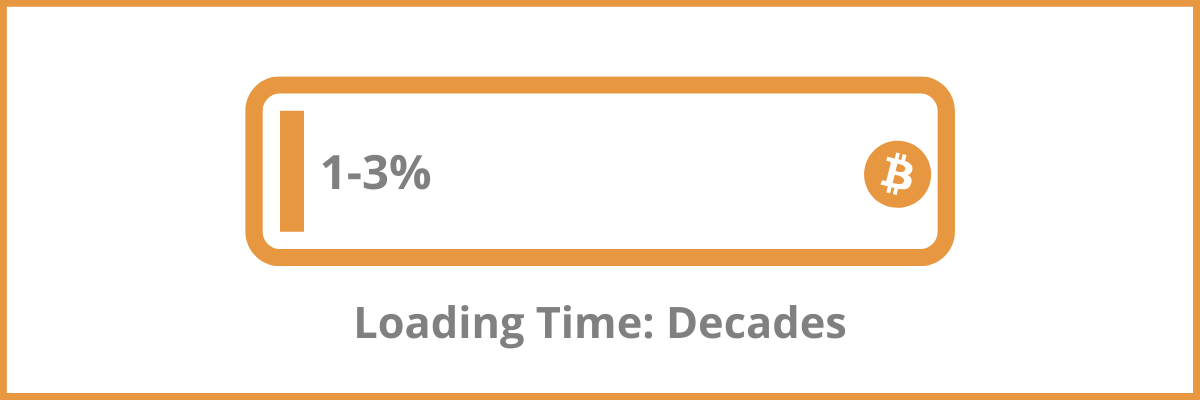
Current estimates signal that the global Bitcoin adoption rate is somewhere between 1-3 percent, depending on the source.122 While that might sound like a small number, Bitcoin is still very young, started at zero, and reached a 1 trillion US Dollar market capitalization in just 12 years. It needs to be acknowledged that Bitcoin is still very much a nascent monetary system, but it has come a long way in a short space of time.
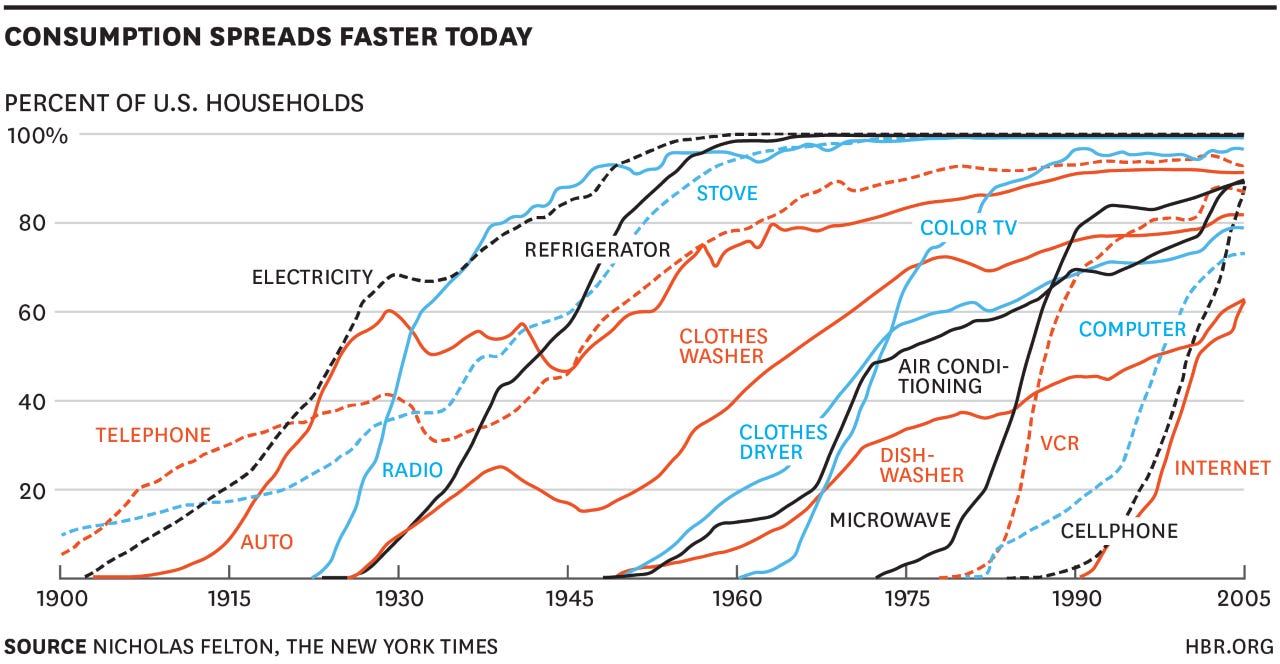
Chainalysis reports that global crypto adoption has surged a whopping 881% last year123 and Bitcoin is being adopted quicker than the internet,124 underlining the theory that the pace of technology adoption is speeding up.125 In regards to user numbers, it took the internet 25 years to get to the point where Bitcoin is now after half the time. Some sources even suggest that the cryptocurrency (including Bitcoin) adoption curve is the fastest in human history.126

While adoption is certainly happening a lot quicker, over 97% of the world’s population is still not onboarded. Reporting on the current Bitcoin wealth distribution while neglecting its short existence, current low adoption, and that its distribution has become much more even over time, can be quite unfair and misleading. Simply put: It is too early to “judge” individual Bitcoin owner distribution at this early adoption stage; instead, the trend is relevant. The market dynamics of Bitcoin, the boom and bust cycles leveraged by its unelastic supply, have also had a positive effect on BTC wealth distribution:
With each of those boom/bust cycles we’ve seen Bitcoin redistributed from old hodlers to new hodlers via selling, decreasing the Gini Coefficient. In 2017 alone, we saw 15% of all BTC move out of old hodler hands.127
“Hodl”, a word based on a spelling mistake in the Bitcointalk forum in 2013,128 simply means “hold” in “crypto terms”. It is not an abbreviation for “Hold on for dear life”, as often propagated. Unchained Capital, an industry-leading company specialized on Bitcoin financial services, introduced “HODL waves” which show that the distribution of BTC increases as the price goes up:129
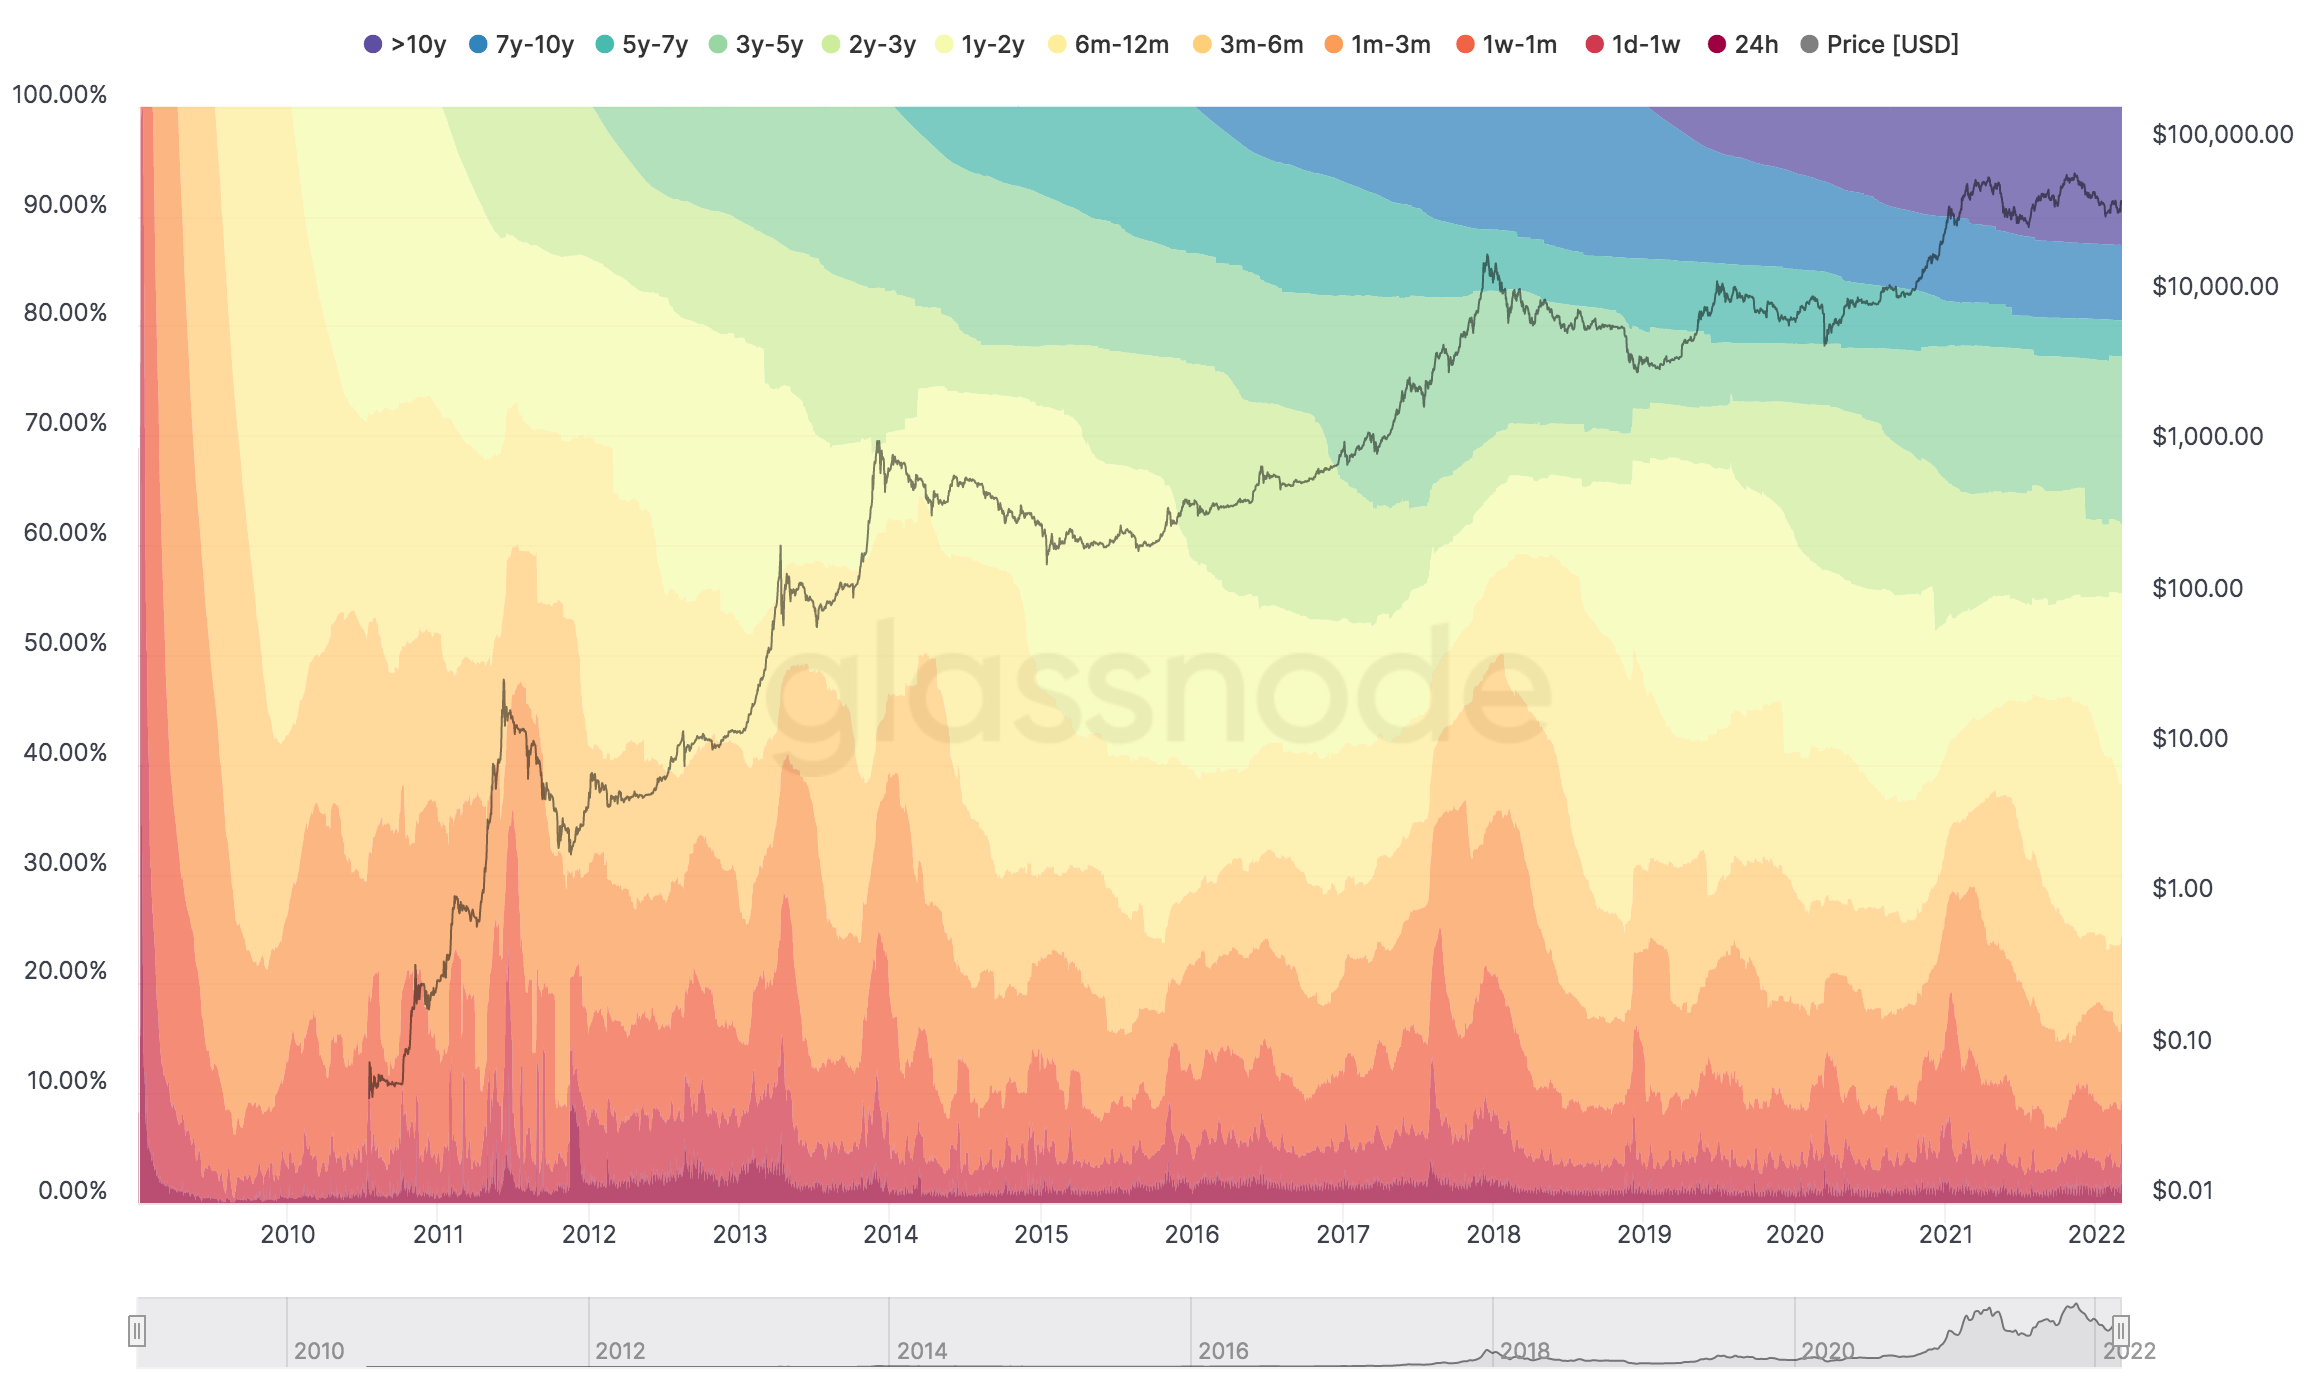
The colored bands show the reletive fraction of Bitcoin in existence that was last transacted within the time window indicated in the legend. The bottom, warmer colors (reds, oranges) represent Bitcoin transacting very recently while the top, cooler colors (greens, blues) represent Bitcoin that hasn’t transacted in a long time.130
Over the duration of Bitcoin’s existence, it becomes clear that the (relative) number of BTC held by smaller entities has increased:131

Note that the above image does not simply show the holdings of Bitcoin addresses over time, but rather the holdings of entities. The visualization is a result of address clustering and advanced data science providing it with more informational significance.132 Additional distribution of Bitcoin among its holders takes place through the decentralized mining process of the last ~10% of total supply over the next ~118 years. Another important factor, often disregarded when discussing Bitcoin wealth distribution, is where the adoption is actually taking place.
5.4. Bitcoin adoption in emerging markets
New technologies are generally adopted quicker in industrialized countries because of various reasons, e.g. they have more resources to invest in research, development, and education. The countries that are good at adopting new technology generally have a higher GDP.133 Additionally, developing countries have to overcome various challenges when adopting frontier technologies, as outlined in the Technology and Innovation Report 2021 published by the United Nations.134 For example, poor infrastructure and financial systems reduce the pace of technological adoption.
Interestingly enough, crypto adoption is growing fastest in emerging markets underserved by existing financial services. The adoption rate is highest in lower-middle income countries:135
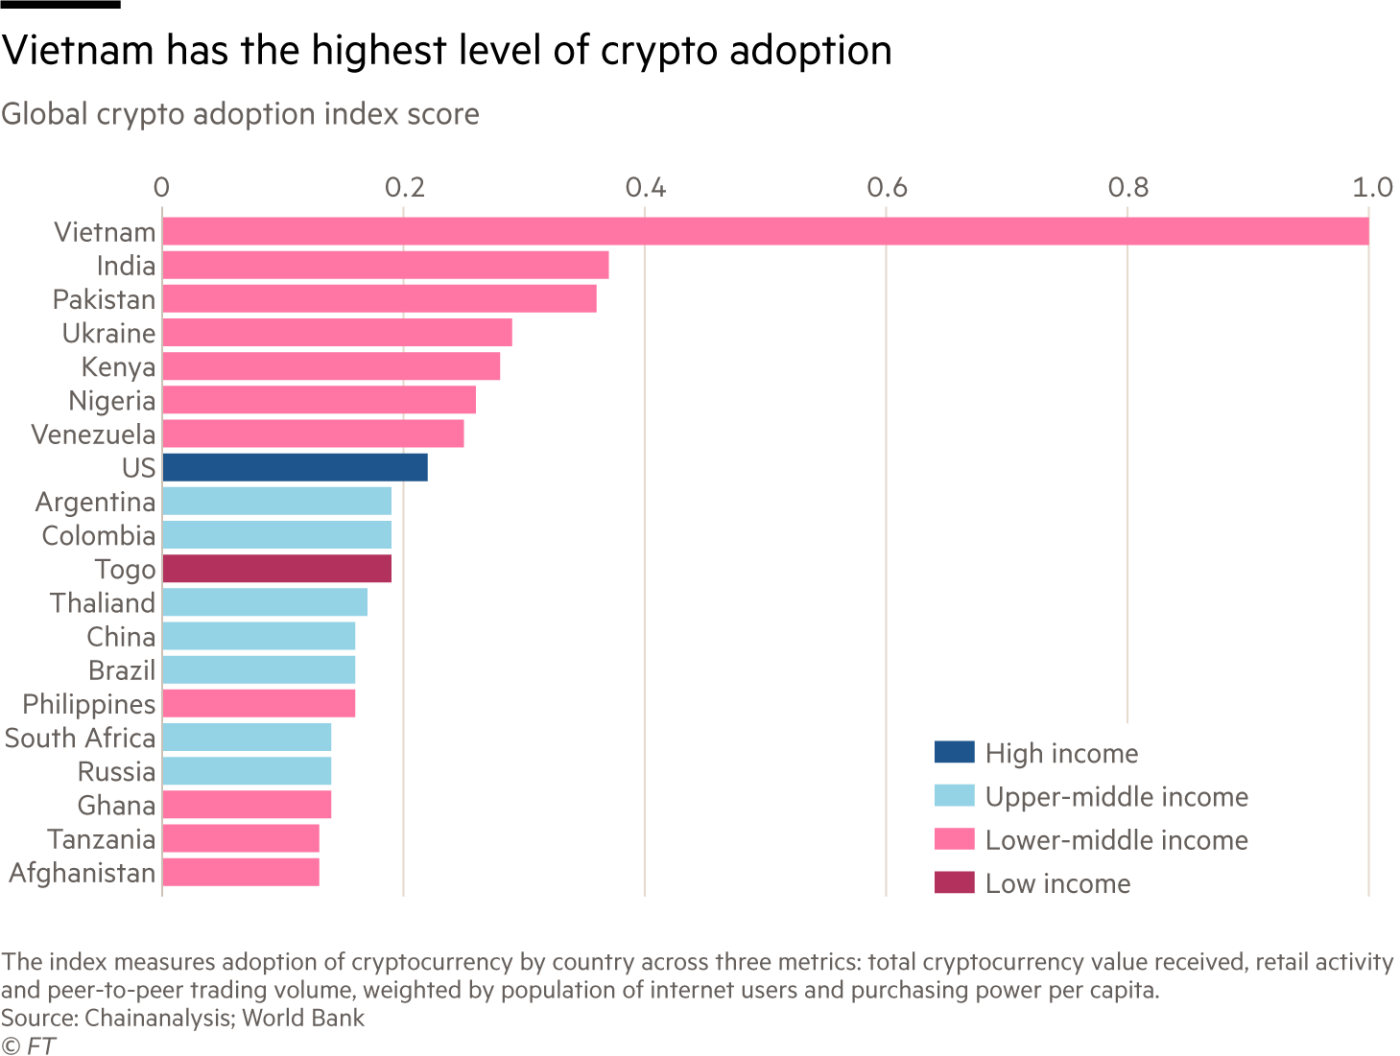
A reason for this could be that developing countries tend to have a much higher inflation rate than developed countries,136 so Bitcoin is more often perceived as a hedge and/or provides more value to the inhabitants of such regions. In developed countries, on the other hand, Bitcoin is often interpreted as a speculative tool – the value of an independent, transparent, and scarce monetary asset is harder to detect in a stable and functioning economy. The extreme volatility of Bitcoin is still the highest barrier for investors, as a recent study of Fidelity finds – it tends to keep people away from the new asset.137 Additionally, the demographic pyramid is significantly different in developing countries, which can be visualized to a certain extent by comparing the population pyramids of Africa and Europe:138
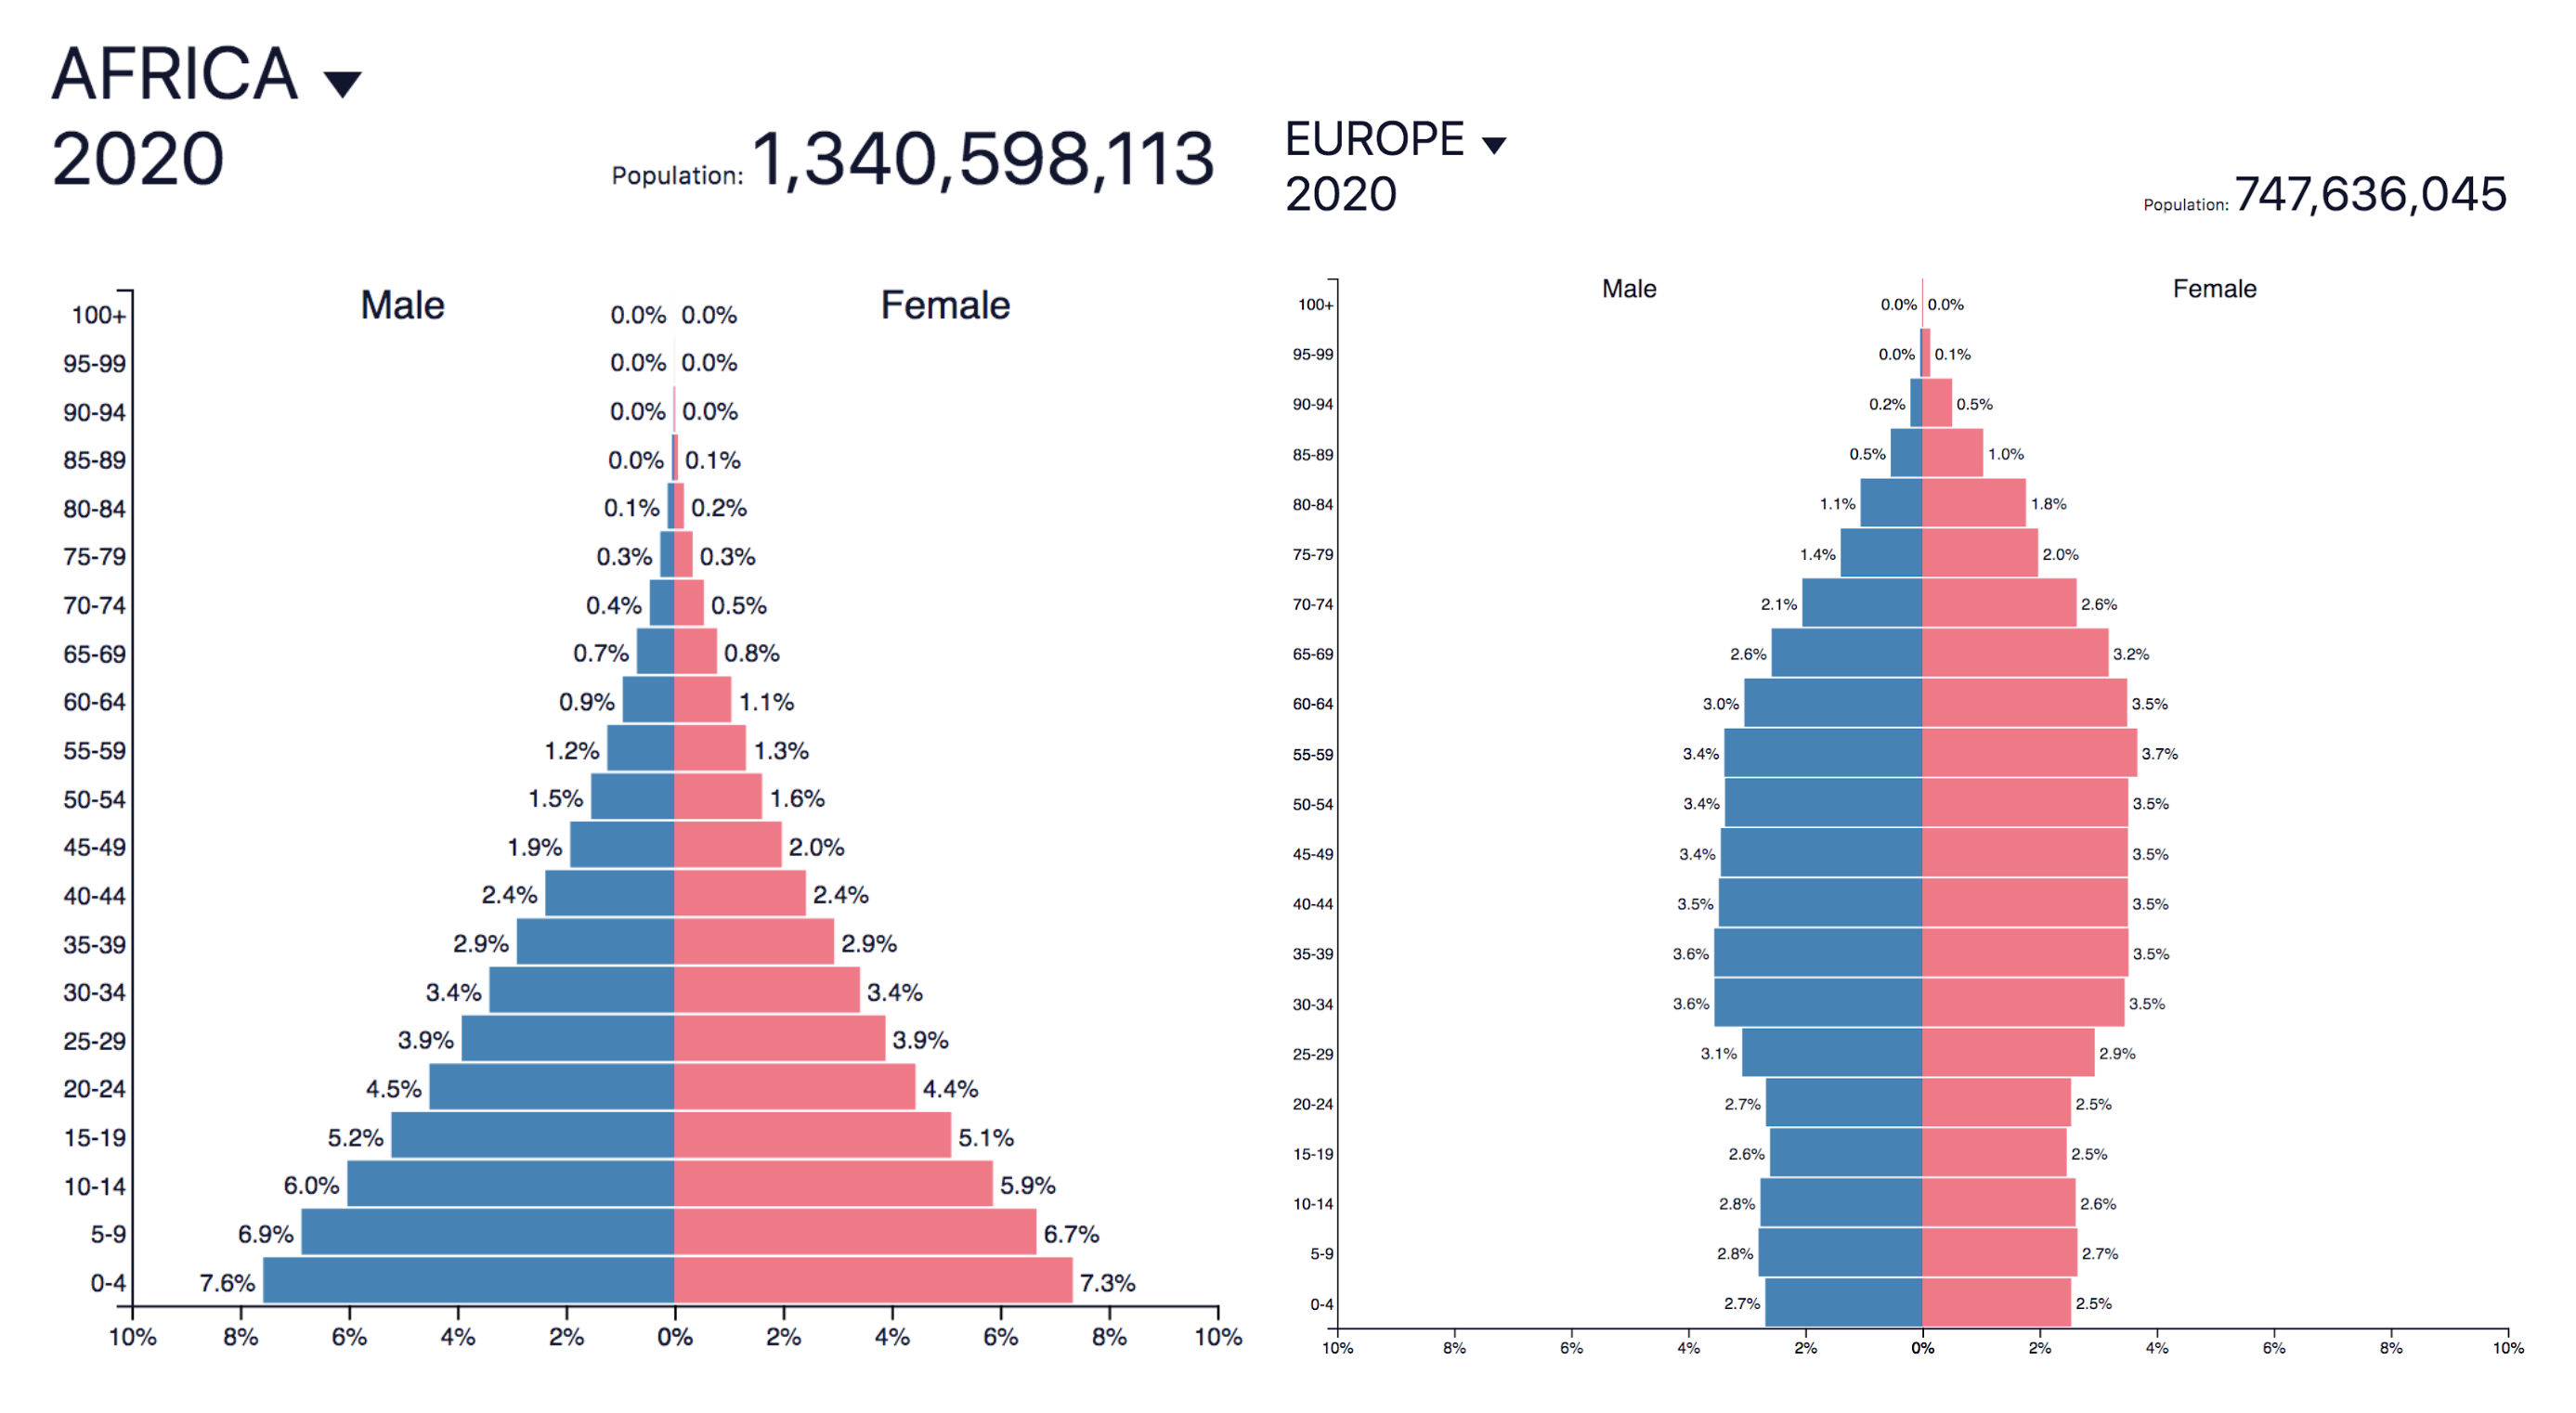
Bitcoin is adopted quicker by younger age groups, as recent Pew Research Center finds.139 Furthermore, the vast majority of the ~1,7 billion unbanked people in the world tend to live in developing countries.140 The financial inclusion Bitcoin can theoretically offer to these affected people creates another attractive incentive to make use of it. In El Salvador, for example, 46% of the population has a Bitcoin wallet, whereas 29% have a bank account.141 Bitcoin achieved in a few months what banks could not provide in decades. The combination of smartphone ownership surging in developing countries142 and the internet becoming more accessible worldwide143 provides Bitcoin with even more fertile ground to grow. Peer-to-peer markets are well-established in some sub-Saharan countries like Nigeria and mobile payment methods are commonly used. A recent study underlines the above statements: Bitcoin can contribute positively to reducing the global imbalance of income and wealth distribution because it provides for greater financial inclusion contributing to lower-income/wealth inequality.144
Bitcoin has the potential to help transfer wealth to younger generations because they benefit at the expense of older investors who are positioned later in the curve of technological adoption. It is an alternative to the existing financial system with fewer entry barriers and it levels the playing field for a larger number of participants – a stateless and self-governing digital currency.
Additionally, Bitcoin potentially pushes back on the Cantillon Effect, which refers to the effect that an increase in the money supply is not automatically distributed evenly across all sectors of an economy, with some sectors (in particular the financial sector) benefiting first, while the rest of the economy follows later or does not benefit at all from money creation.145 A case study titled “The impact of monetary systems on income inequity and wealth distribution: A case study of cryptocurrencies, fiat money and gold standard” finds:
[…] that cryptocurrency and gold standard monetary systems contributed significantly to reducing global inequality of income and wealth distribution. Conversely, the traditional fiat money system contributes positively to global income and wealth inequality while also contributing significantly to their fluctuation.146
These findings indicate that global wealth distribution is heading in the opposite direction of Bitcoin; becoming more heavily concentrated – the topic of the next chapter.
[…]
Did you like the second part of this article? Look forward to the last fourth part!
You can get more information about the author -Michael Weymans- here on LinkedIn.
A previously published article by this author, can be found hier.
Original source: https://blog.bitbeginner.com/p/70b13407-7a78-4e56-acd1-e1365b8adbd9?s=r