Bitcoin Wealth Is Becoming More Evenly Distributed Over Time 4/4
Bitcoin Wealth Is Becoming More Evenly Distributed Over Time
Widespread Estimates Of Individual Bitcoin Ownership Concentration Are Oversimplified And Irrelevant.

This content is for informational purposes only, you should not construe any such information or other material as investment, financial, or other advice.
Before reading the second part of the article, you can find the first part of the article here.
[…]
6. Global wealth distribution trends
Bitcoin is not a local or country-bound system – it’s global, ignoring the borders of nations. Therefore, to place Bitcoins distribution into a real-world context, it is worth looking into new reports investigating global wealth inequality. As mentioned in chapter 5.3., distribution metrics between the two are not comparable at this early point of time, because Bitcoin is at a 1-3% adoption rate (and still in the early distribution process). But I believe that global wealth distribution and its trends are mention-worthy for this article and show if it has been becoming more concentrated in the past, which would be the opposite of Bitcoin. Just like Bitcoin, it is not an easy undertaking to measure global wealth distribution, as financial globalization makes it increasingly hard to measure wealth at the top:
New data sources (leaks from financial institutions, tax amnesties, and macroeconomic statistics of tax havens) can be leveraged to better capture the wealth of the rich.147
The current distribution of global wealth
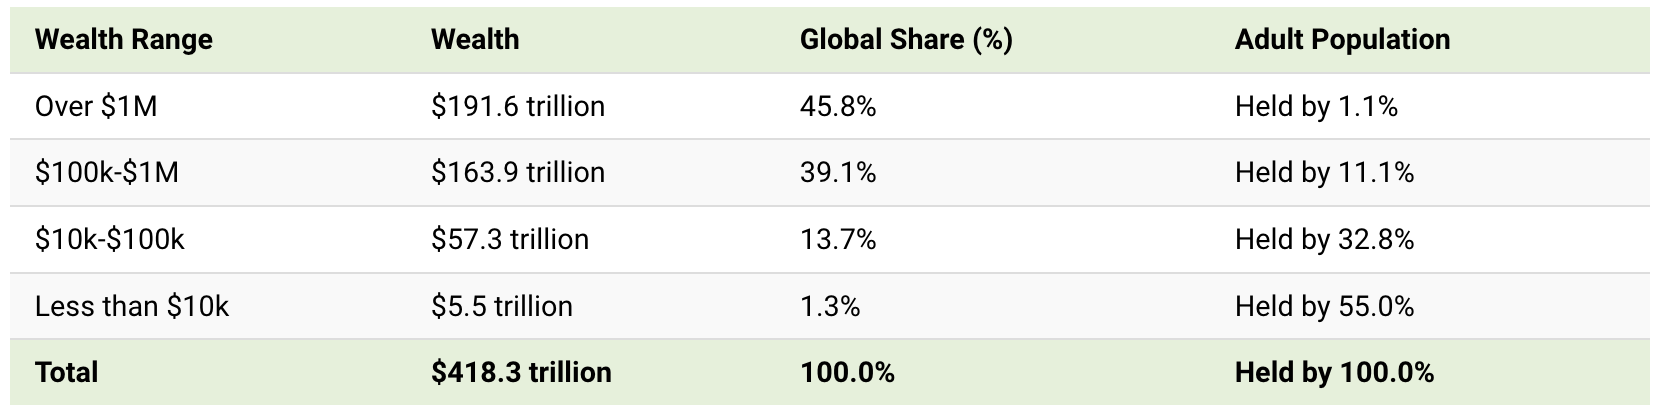
According to the Global Wealth Report 2021 published by Credit Suisse, approximately 45,8% of global wealth is held by the richest 1,1% of the adult population. On the other side of the scale, 55% of the adult population (~2.9 billion) owns only 1,3% of global wealth:148
A graphic based on the findings of the recent Credit Suisse report visualizes the unequal distribution outlined above, the top ~12% own ~85% of global wealth:149

The most recent report published by Oxfam International indicates that the 10 richest people in the world own more than the bottom 3.1 billion people combined.150
Trends of global wealth distribution
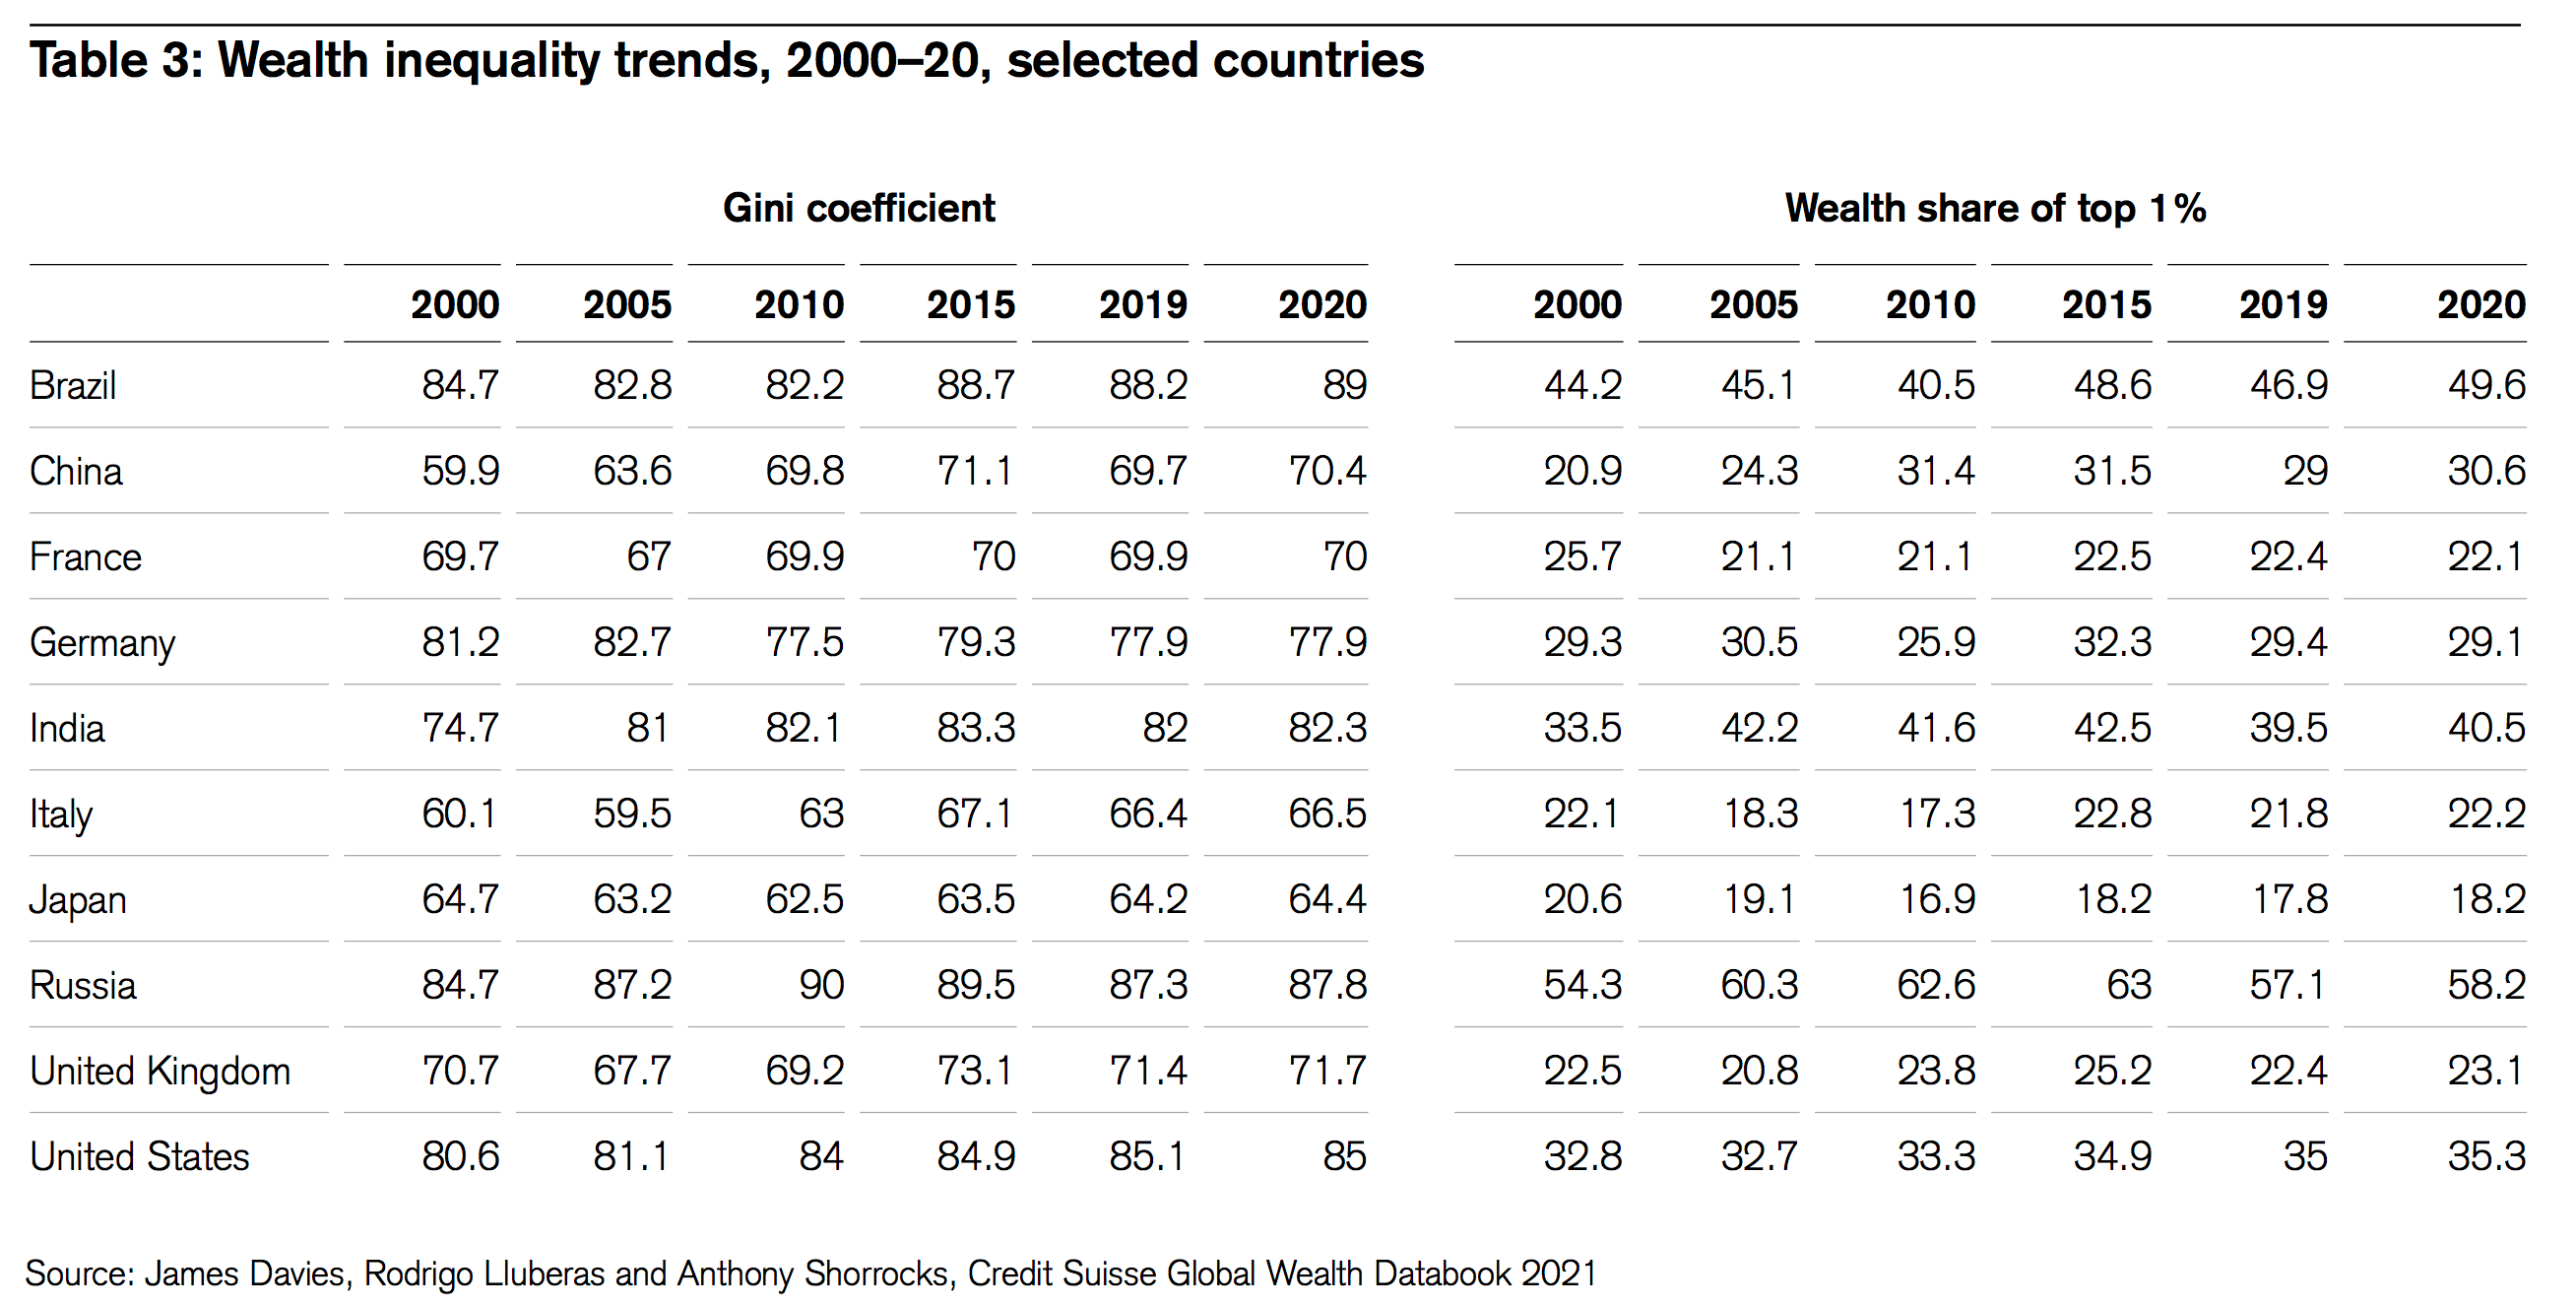
Global wealth distribution trends differ vastly from country to country. For example, wealth has become slightly more evenly distributed in Germany over the last two decades, when looking into the Gini coefficient. On the other hand, wealth is becoming increasingly more heavily concentrated in countries like China, where the top 1% now share more than 30% of the wealth, compared to ~21% in 2000.151
Zooming out and observing wealth inequality on a global scale, the trend has been the same for several decades:
Evidence points toward a rise in global wealth concentration: For China, Europe, and the United States combined, the top 1% wealth share has increased from 28% in 1980 to 33% today, while the bottom 75% share hovered around 10%.152
In Russia and the United States, the rise in wealth inequality has been more evident, whereas in Europe it has been more moderate.153 The wide gap in wealth levels between countries is paralleled by the wide disparity in wealth within countries. As for high net worth individuals; they have been increasing their share of global wealth over the last two decades:
HNW are increasingly dominant in terms of total wealth ownership and their share of global wealth. The aggregate wealth of HNW adults has grown nearly four-fold from USD 41.5 trillion in 2000 to USD 191.6 trillion in 2020, and their share of global wealth has risen from 35% to 46% over the same period.154
For example, the world’s ten richest people doubled their fortunes during the pandemic.155 The wealth gap is widening on a global scale.
7. Wealth distribution of other cryptocurrencies
In a recently published research article, the authors measured and characterized wealth inequality in different cryptocurrencies.156 The results indicate that most of the time, the higher the market capitalization of a cryptocurrency the more even the distribution becomes:
“Our findings suggest that major crypto economies are similar to conventional economies in terms of wealth distribution […] however, there is a trend towards more even wealth distribution among large cryptocurrencies over time.”157
Just like with BTC, the trend of a high Gini value when the adoption is low is prevalent in all other cryptocurrencies analyzed in the research article:158
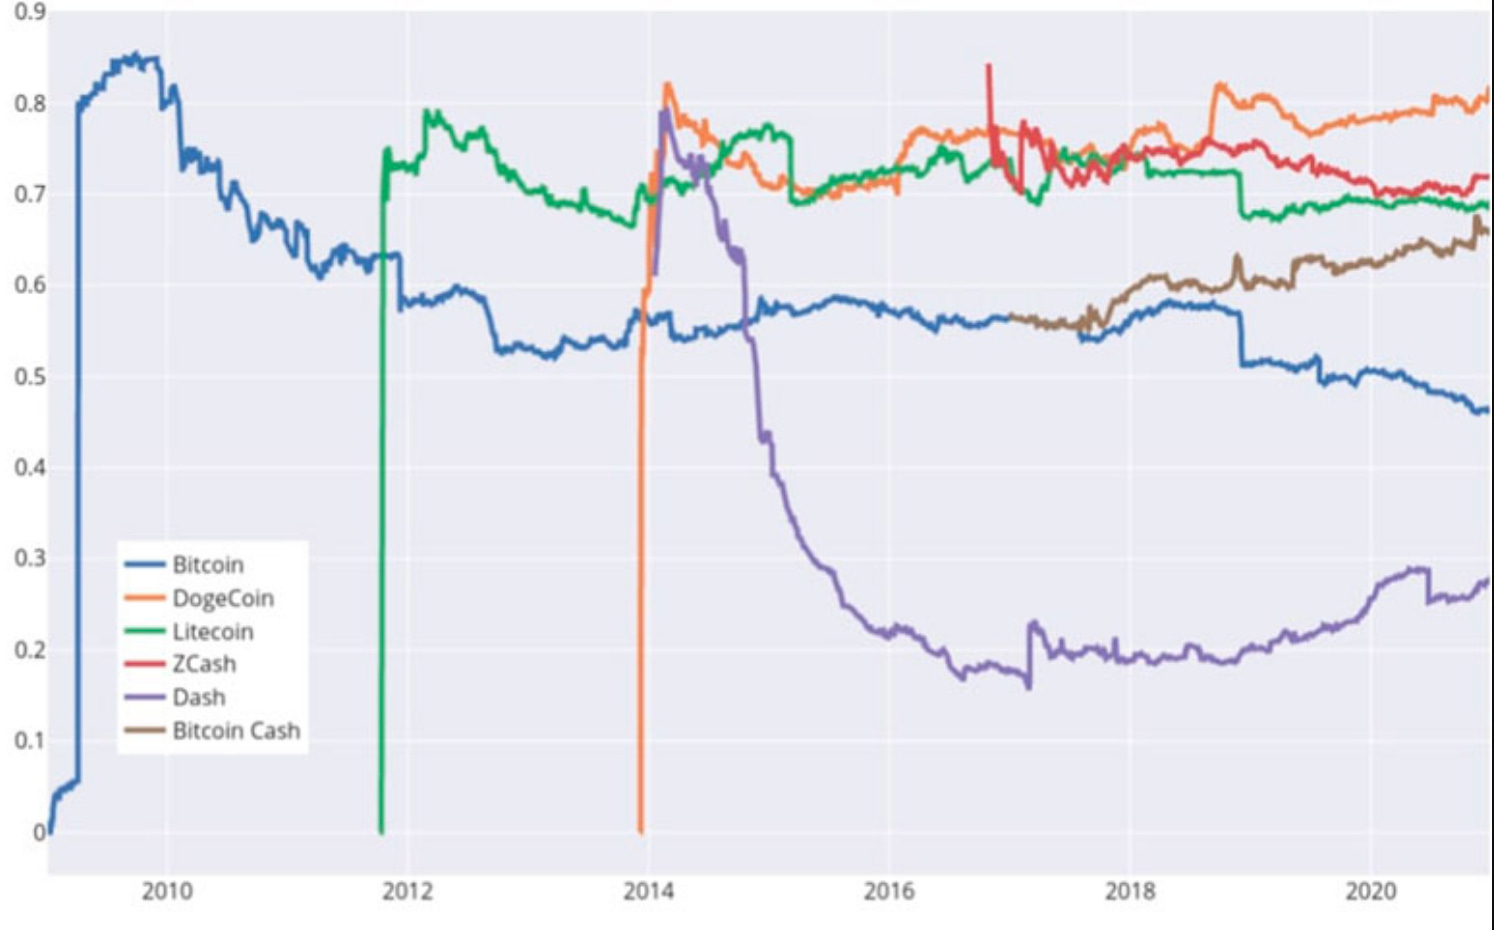
Overall, there seem to be three distinctive trends in terms of wealth concentration in Bitcoin-like cryptocurrencies: those that tend to on average stay at a higher Gini value than Bitcoin over time (Dogecoin and Bitcoin Cash), those that have a higher Gini value than Bitcoin but demonstrate a slightly downwards trend over time (Litecoin and ZCash) and finally those that have a lower Gini value than Bitcoin but have started to see an increase in their Gini value now (Dash).
The Gini coefficient does not necessarily become lower for all cryptocurrencies over time:
Cryptocurrencies such as Dogecoin do not demonstrate a similar trend towards a fairer wealth distribution despite the increase in adoption. […] unlike Bitcoin, Dogecoin trends towards an increase in the overall wealth concentration.
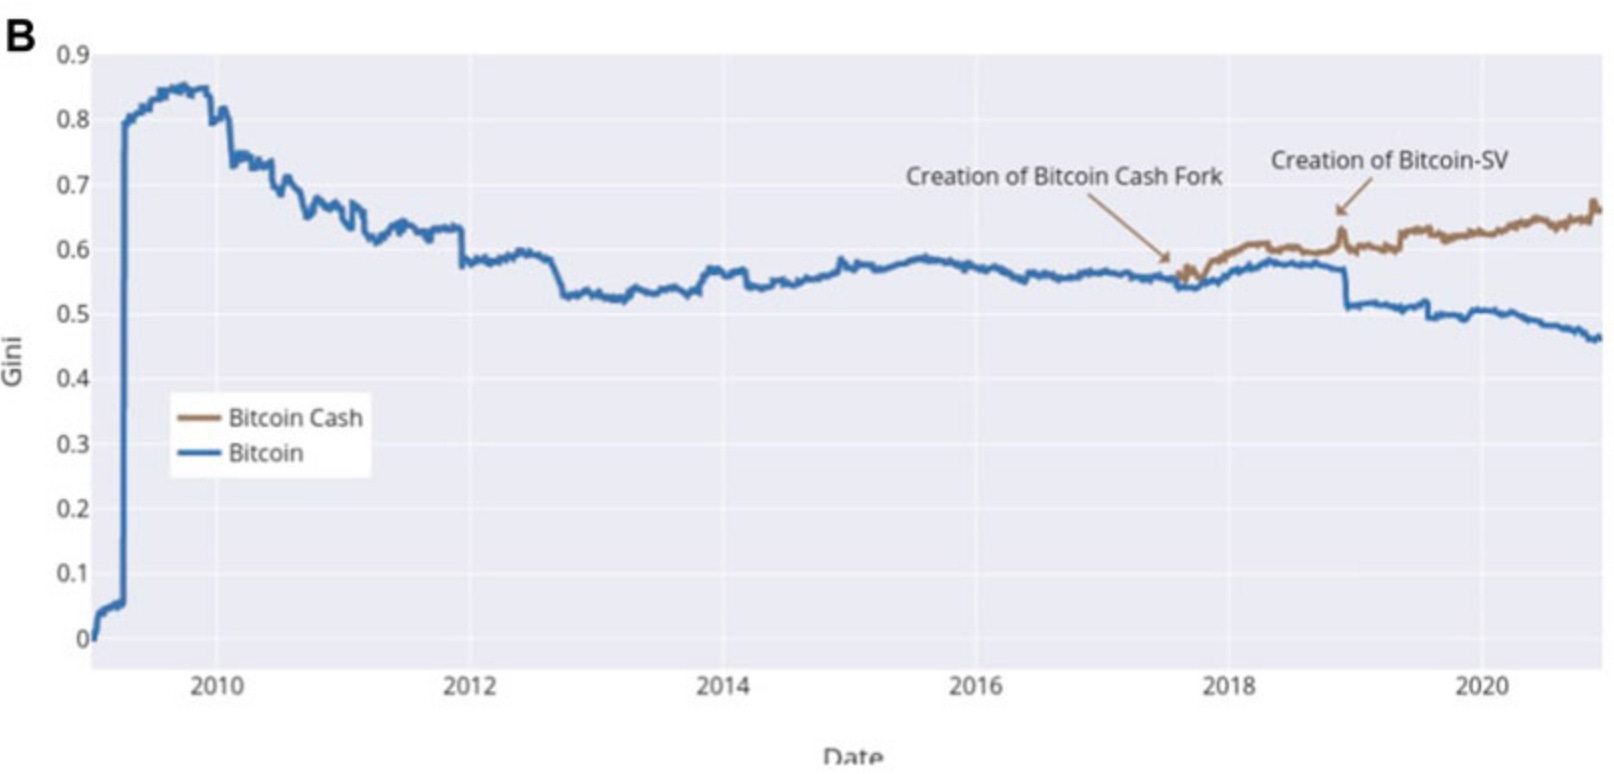
Dogecoin had the highest observed Gini value of all analyzed cryptocurrencies (0.82), but it is not the only one trending towards an increase of wealth concentration among its users. The same goes for Bitcoin Cash and other Bitcoin forks; they are on a continuous path of increasing wealth concentration since their creation:159
Yet again, the same can be observed with the Ethereum fork “Ethereum Classic”:160
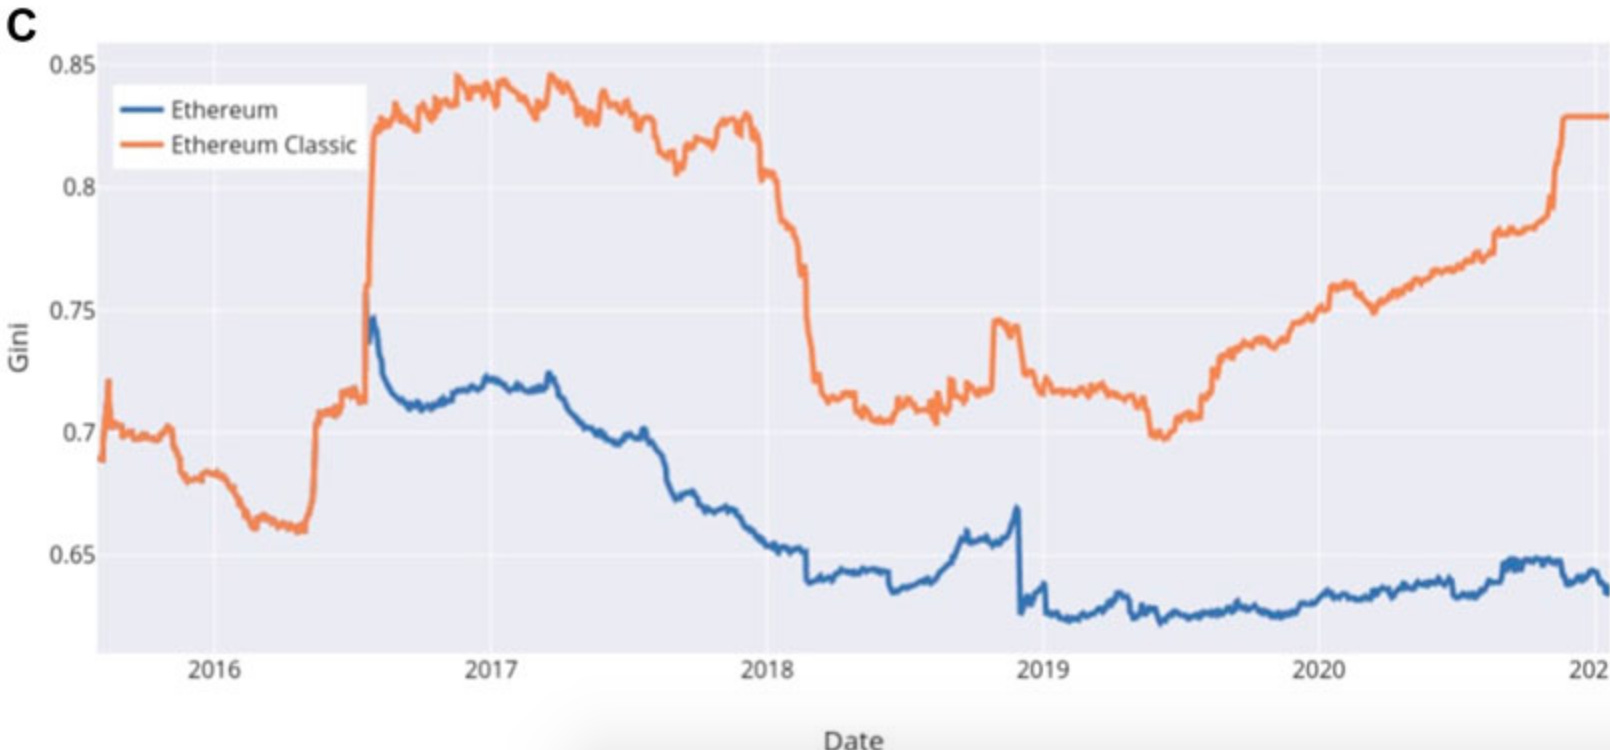
Additionally, some of the observed cryptocurrencies (Dogecoin, ZCash, and Ethereum Classic) violate the honest majority assumption (a very low Nakamoto index) with less than 100 participants controlling over 51% wealth in the ecosystem, potentially indicating a security threat.
Alarming numbers for token projects
The overwhelming majority of all tokens are positioned in the range of a Gini coefficient from 0.9 to 1.0 and a Nakomoto index below 100. In other words, they are very unevenly distributed. For the few token exceptions with a lower Gini coefficient, a token airdrop campaign could have easily changed the distribution, creating an artificially low Gini level. In general, tokens are having a very unnatural and artificial distribution, with high Gini, high Theil, and low Nakamoto index metrics.161
8. Conclusion
Although the public nature of the Bitcoin blockchain enables big data analyses (chapter 1), estimating individual Bitcoin investors’ wealth concentration is a non-trivial task. There are many variables to account for and most of them cannot be accurately determined (chapter 2). The top 2% of the richest Bitcoin owners are estimated to control an upper bound of ~71.5%, while a lower bound could be well under 50% (chapter 3.1.). For comparison, the richest ~1% own ~45% of today’s global wealth (chapter 6). Often cited and widespread news of heavily concentrated individual Bitcoin holders’ ownership are oversimplified and not put into context (chapters 3, 4, and 5). The launch of Bitcoin was conceptualized as fair as possible (chapter 4) and it is too early to present a concluding statement on individual Bitcoin owner distribution at this early adoption stage; instead, the trend is relevant. Despite its young age, BTC distribution is already in line with real-world economies (chapter 5.1.). Bitcoins boom and bust market dynamics, decentralized production, rising price tag, and increasing adoption have significantly contributed to a more even distribution in the past (chapter 5). Individuals in low-middle income countries tend to be adopting Bitcoin faster than people in industrialized nations, possibly leveraging a further wealth re-distribution both from “rich to poor and old to young” (chapter 5.3.). Bitcoin pushes back on the Cantillon Effect (chapter 5.4.) and could positively contribute to reducing the global imbalance of wealth distribution because it provides for greater financial inclusion (chapter 5.4.). Traditional fiat-based monetary systems tend to become more concentrated over time. The rich become richer – the wealth gap has been widening for several decades (chapter 6) while ~1,7 billion people still remain unbanked today. Most other cryptocurrencies are more heavily concentrated than Bitcoin and some are even becoming more concentrated over time (chapter 7).
You can get more information about the author -Michael Weymans- here on LinkedIn.
A previously published article by this author, can be found hier.
Original source: https://blog.bitbeginner.com/p/70b13407-7a78-4e56-acd1-e1365b8adbd9?s=r